Comparisons
ZymoBIOMICs ANI Benchmarks
The following contains a series of benchmarks and comparisons of Lorikeet against a variety of other tools. These benchmarks are based off of the benchmarks performed in the inStrain paper.
The first benchmarks involves the use of the ZymoBIOMICs microbial community standard samples generated by Olm et al. Each sample
represents a technical replicate of the same microbial community, as such the distribtion of variants found within each sample
should ideally be identical. That is, a variant found in sample 1 should also be found in sample 2 and 3. Additionally, the dominant allele
in each sample should be identical. ANI values were calculated for each tool by Olm et al. and conANI and popANI values were
generated by me for inStrain since the original paper did not provide the conANI values for inStrain. Lorikeet also generated
conANI, popANI, and subpopANI for each sample and each genome. ANI values close to or at 1.00 are ideal, as that means that the
same set of alleles was found within each sample. The results are as follows:

Here we can see that Lorikeet and inStrain both manage to perform well on the popANI metric. Lorikeet calculating 1.00 popANI for all sample comparisons and inStrain generating 1.00 for 23 out of 24 sample comparisons. However, Lorikeet also managed to generate conANI values at or very close 1.00 for all sample comparisons, something that all other tools fail to do. The subpopANI values for Lorikeet show the most variation which makes sense as it is the most stringent measurement most likely to be affected by sequencing error. Lorikeet still manages to calculate subpopANI values at or very close to 1.00 for most sample comparisons.
Another point of comparison for these tools is the time it takes to completely run the algorithm workflow (sans read mapping). To analyze this we compared the time taken to profile or call variants on two of the ZymoBiomics reference genomes across all three samples for inStrain, GATK HaplotypeCaller, and Lorikeet. Each benchmark for each tool was performed five times and no external tools like GNU parallel were used. Since only one BAM file could be provided to inStrain at a time, the results for a single benchmark were the cumulative time taken to analyze all three samples. This is fair since the other tools could be provided all three samples at once without any hassle from the user.
Variant calling performance
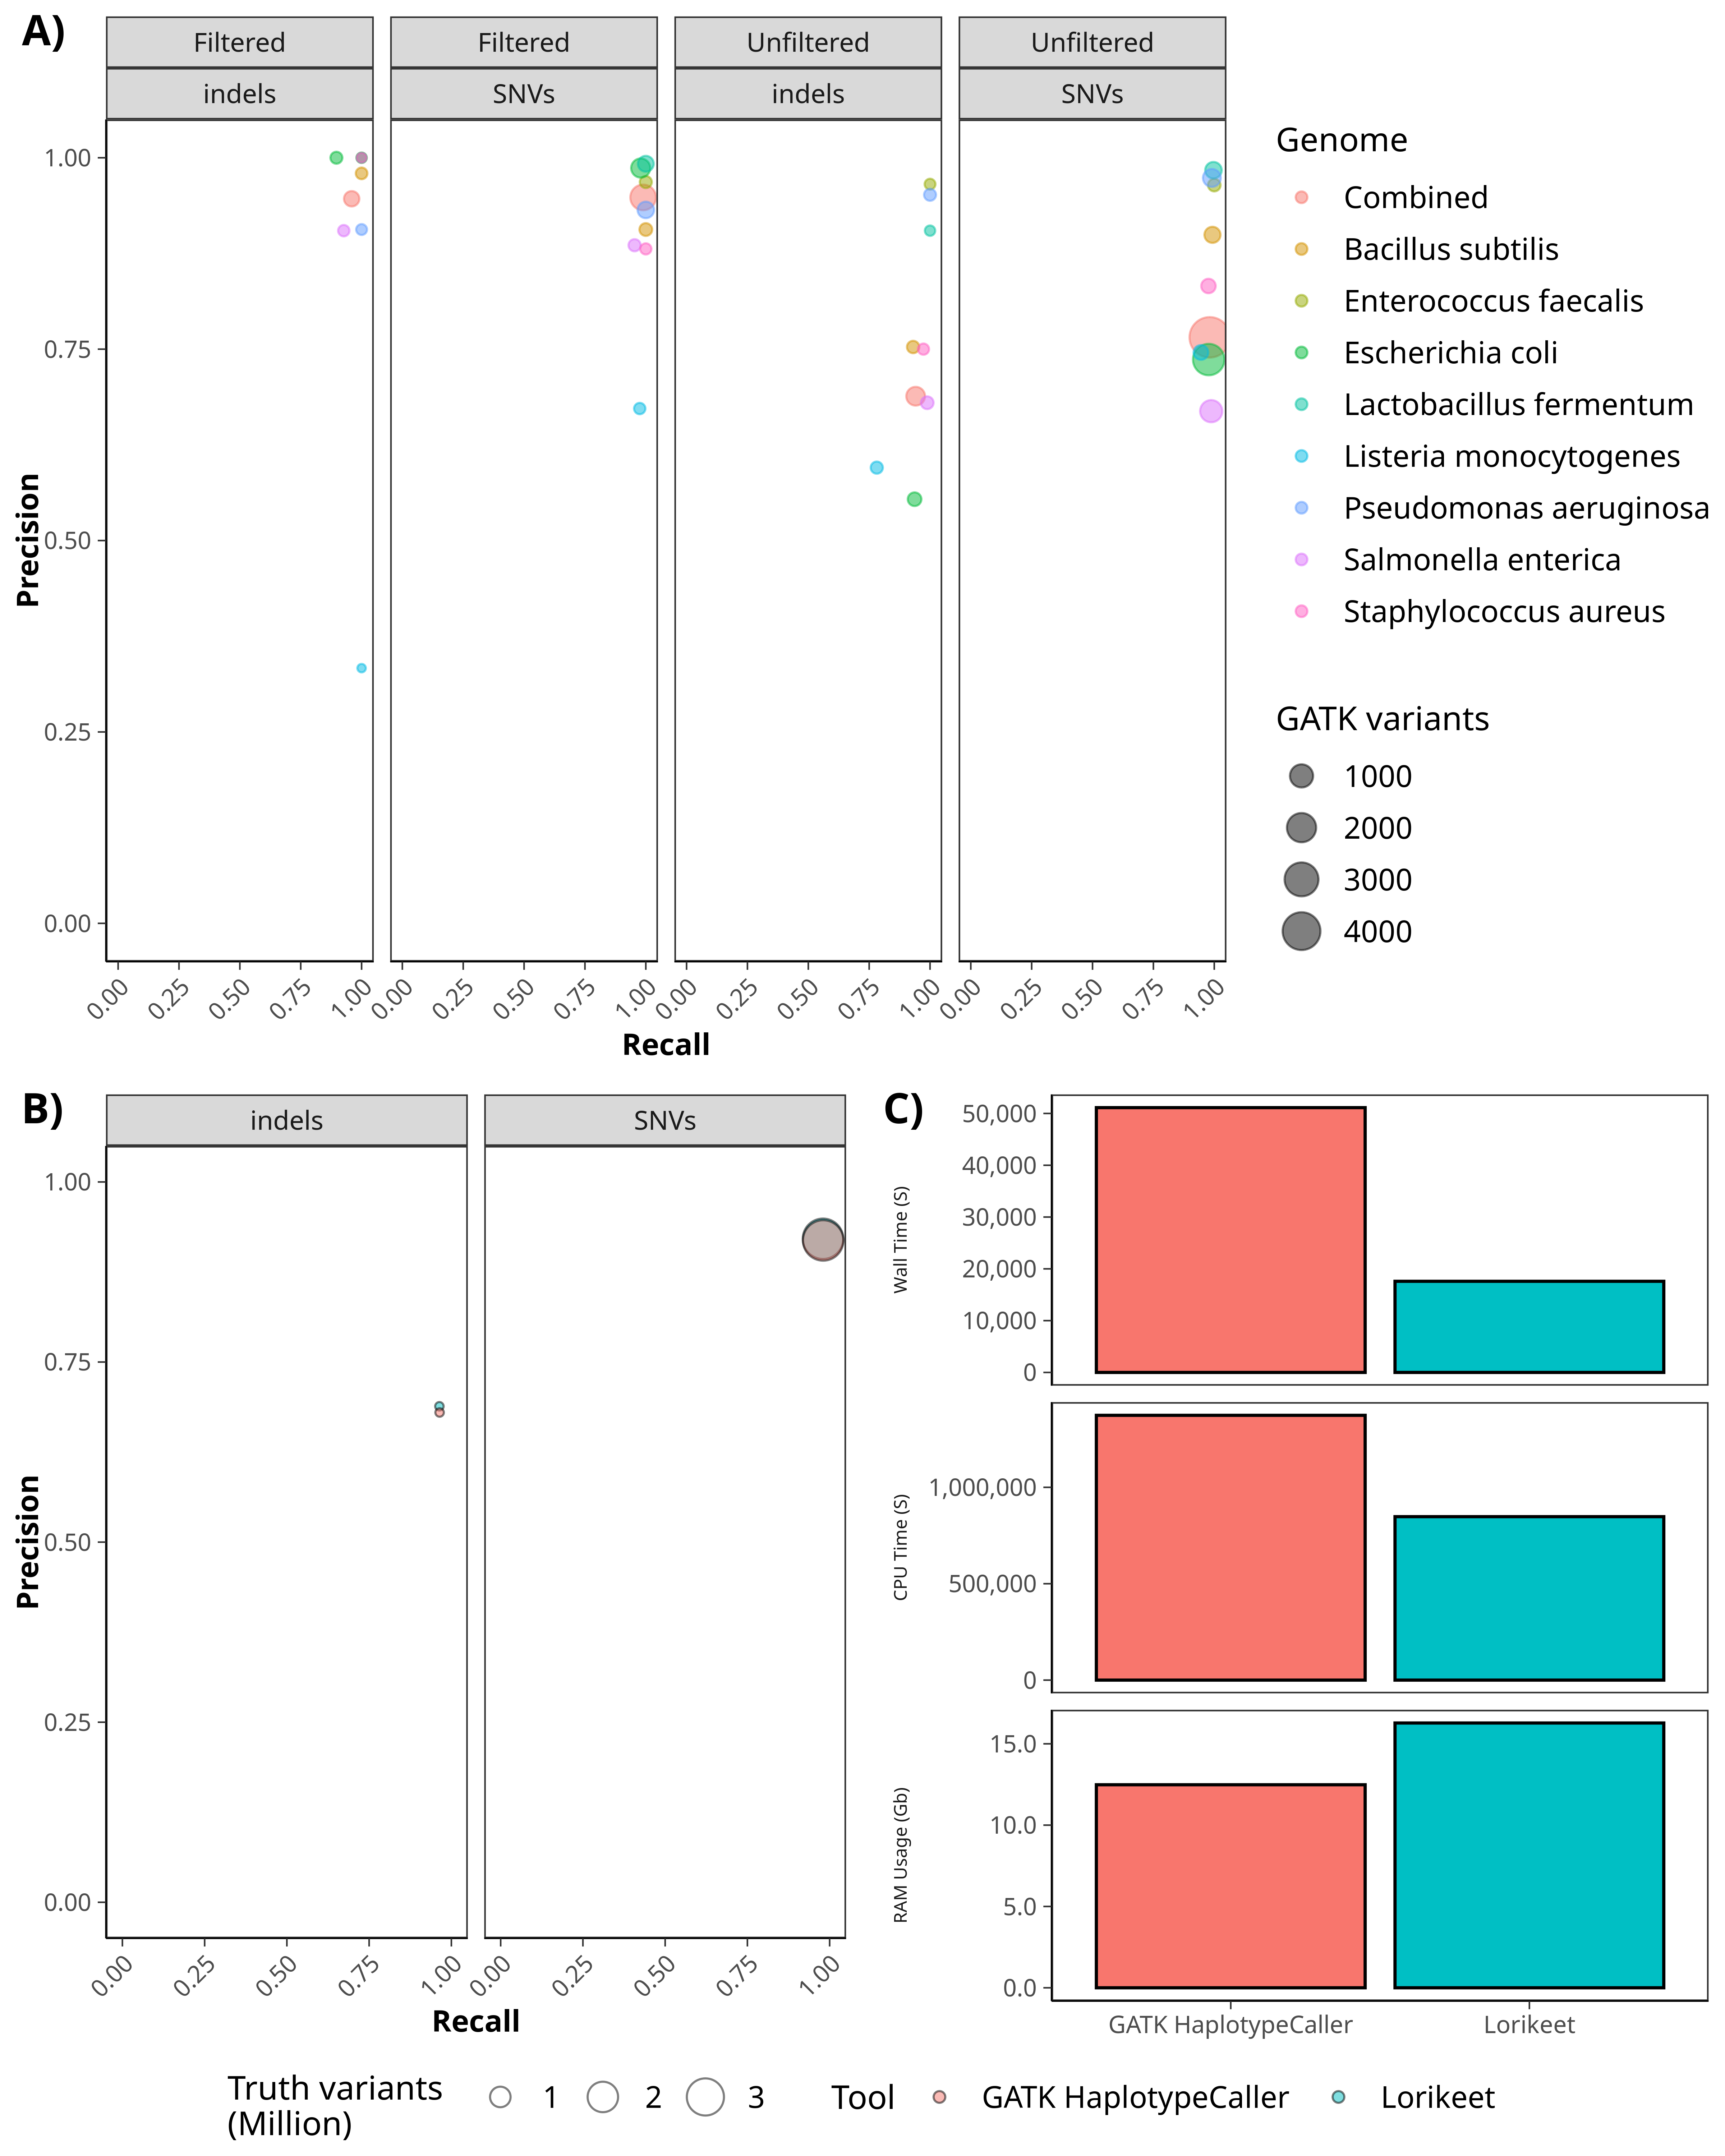 This plot shows the level of variant call concordance between HaplotypeCaller and Lorikeet on the ZymoBiomics genomes (A).
Additionally, this plot shows the precision and recall values of Lorikeet and HaplotypeCaller on the NA12878 human variant calling
benchmark dataset (B). The performance for each tool is nearly identical. Finally, we compare the wall time, CPU time, and RAM
requirements for running Lorikeet and HaplotypeCaller on the NA12878 dataset (C).
This plot shows the level of variant call concordance between HaplotypeCaller and Lorikeet on the ZymoBiomics genomes (A).
Additionally, this plot shows the precision and recall values of Lorikeet and HaplotypeCaller on the NA12878 human variant calling
benchmark dataset (B). The performance for each tool is nearly identical. Finally, we compare the wall time, CPU time, and RAM
requirements for running Lorikeet and HaplotypeCaller on the NA12878 dataset (C).
Powered by Doctave